
Text Classification of Amazon Reviews
In this blog post, I explore architectures like Logistic Regression, Support Vector Machines, Convolutional Neural Networks and fasttext to classify Amazon Reviews as positive or negative for a product.
INTRODUCTION
Text classification also known as text tagging or text categorization is the process of categorizing text into organized groups. By using Natural Language Processing (NLP), text classifiers can automatically analyze text and then assign a set of pre-defined tags or categories based on its content.
Unstructured text is everywhere, such as emails, chat conversations, websites, and social media but it’s hard to extract value from this data unless it’s organized in a certain way. Doing so used to be a difficult and expensive process since it required spending time and resources to manually sort the data or creating handcrafted rules that are difficult to maintain.
Text classification is becoming an increasingly important part of businesses as it allows to easily get insights from data and automate business processes. Some of the most common examples and use cases for automatic text classification include the following:
-
Sentiment Analysis: the process of understanding if a given text is talking positively or negatively about a given subject (e.g. for brand monitoring purposes).
-
Topic Detection: the task of identifying the theme or topic of a piece of text (e.g. know if a product review is about Ease of Use, Customer Support, or Pricing when analyzing customer feedback).
-
Language Detection: the procedure of detecting the language of a given text (e.g. know if an incoming support ticket is written in English or Spanish for automatically routing tickets to the appropriate team).
DATASET
For this analysis, the freely available Amazon Reviews dataset [1] was used. The dataset contains 3,000,000 amazon reviews and their ratings which vary from 1 (worst) to 5 (best). Since fitting multi-class classification models is computationally intensive, the 5 rating values were converted into a binary label. Ratings 1 and 2 were assigned a label of 0 (negative) and 4 and 5 were assigned a label of 1 (positive).
The text data within each review was tokenized using the python regular expression package re. It was observed that there were cases where the reviews were blank (no. of words identified = 0). These reviews were dropped from the analysis as there was no training data for these. The average and the max length (number of words) for the reviews having the label as 0 was 80.2 and 254 respectively and for label as 1 was 74.1 and 436 respectively. Furthermore, the training data of 3,000,000 was too big to train through all the algorithms efficiently. Therefore, the data was randomly subsampled to 500,000 reviews.
METHODS AND RESULTS
Once the ratings data was tokenized, it was time to train the models for the text classification. The features were the rating text and the target was the label of 0 and 1 as defined above.
LOGISTIC REGRESSION
The first model that was fit was logistic regression. Logistic regression only works with numeric data. Therefore, the tokenized review texts needed to be converted to numeric features. Term Frequency - Inverse Document Frequency (TF-IDF) was used to do this. TF-IDF is a term weighting scheme. It assigns a weight to each term present in a review depending on the it’s number of occurances (directly propotional) and the number of reviews the term is present (inversely propotional). The sklearn implementation of the logistic regression linear model was used to train the model on this feature vector.

5-fold cross validation and extensive grid search was used to determine the best performing hyperparameters. The following hyperparameter combinitions were tested:
- tfidf max_df: 0.25, 0.5, 0.75
- tfidf max_features: None, 5000, 10000, 50000
- tfidf ngram_range: (1, 1), (1, 2)
- Logistic Regression C: 0.01, 1, 100
A total of 360 regression models were fit to ascertain the best performing model, and the test tool around ~2hrs 50min. The best performing model had C=100, max_df = 0.5, max_features = None and ngram_range = (1,2) with the mean test accuracy of 0.9041.
SUPPORT VECTOR MACHINES
The support vector machine experiment also followed similar steps as Logistic Regression. The review data was vectorized using TF-IDF and the sklearn LinearSVC SVM implementation was used for training the model. 5-fold cross validation and extensive grid search was used to determine the best performing hyperparameters. The following hyperparameter combinitions were tested:
- tfidf max_df: 0.25, 0.5, 0.75
- tfidf max_features: 100, 500
- tfidf ngram_range: (1, 1), (1, 2)
- SVM C: 0.01, 1, 100
The max_features counts were reduced as compared to logistic regression so that the models could fit in agreeable time. A total of 180 regression models were fit to ascertain the best performing model, and the test tool around ~1hrs 30min. The best performing model had C=1, max_df = 0.75, max_features = 500 and ngram_range = (1,1) with the mean test accuracy of 0.8023. We can see that the maximum accuracy observed is only 0.80 as compared to 0.90 for logistic regression for the best performing model. The reason for this is the lower number of features used. In order for us to identify the best performing SVM, it is recommended to try out hyperparameter combinations with higher number of features.
fasttext
fasttext [3] is a library developed by Facebook for efficient text classification and representation learning. It is designed to work on standard generic hardware. 5-fold cross validation and extensive grid search was used to determine the best performing hyperparameters. The following hyperparameter combinitions were tested:
- LR: 0.01, 0.1, 0.5, 1.0
- wordNgrams: 1, 2
- dim: 100, 500, 1000, 5000
The best performance model has hyperparameters lr = 0.01, wordNgrams = 2 and dim = 500 and achieves a mean test accuracy of 0.8957.
CONVOLUTIONAL NEURAL NETWORKS
The convolutional neural network model utilized a slightly different approach as compared to the above methods. Since the number of potential hyperparameter combinations that could be tested were humongous to arrive at the optimal model, I took the model architecture proposed in the dataset research paper [2] as my final architecture to train. Figure 2 below illustrates the same.
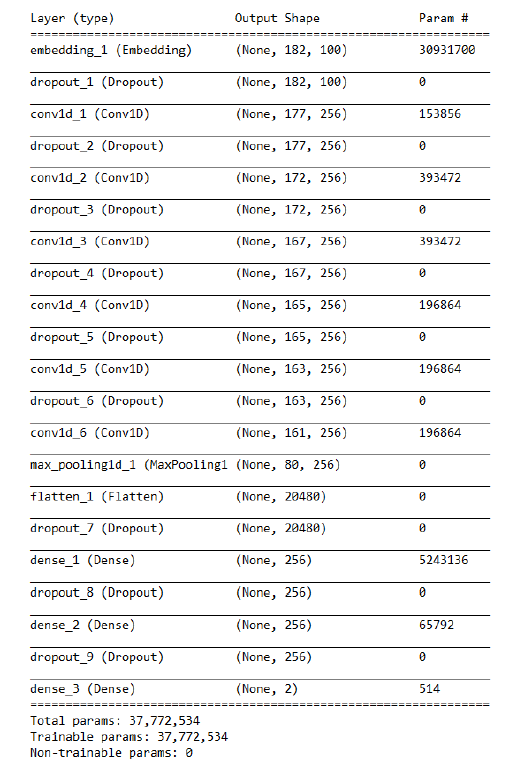
As step 1, the tokenized ratings text was converted into dictionary indices using the gensim library. Each rating was restricted to a sequence length equal to the 99th percentile observed for the rating length in the training dataset. The first layer in the CNN model was an embedding layer. word2vec was used to convert the input dictionary indices into features of length 100. There were a total of 6 CNN layers and two fully connected layers each configured with the ‘relu’ activation. The final layer was a dense layer pwith a ‘softmax’ activation predicting the probability of 0 or 1. A dropout of 0.3 was used at all layers to prevent the model from overfitting. A L2 penalty of 0.0003 was used for the fully connected layers and the dense layer. Early stopping was used with patience = 3 to train the model. A validation split of 0.1 was used.
The model trained for ~2hrs and 9 epochs. The final trained model was able to achieve a validation accuracy of 0.9107.
SAMPLE RESULTS
Prediction APIs were built for the SVM and CNN models to predict the label for any new amazon product review. The following are examples of how the model performs for random reviews selected from amazon.com:
Example 1:
Review Text: I have had these for a while now and wanted to try them out before posting a review. All I can is that they are worth it and have definitely outlasted other shoes I have had. I am always hiking, jogging or walking my pups and these shoes are still holding on strong. Definitely recommend these. That photo I posted is of the shoes is after months of activities and they still have grip and look good.
Ground Truth: 5
SVM Prediction: “label”: “1”
CNN Prediction: “label”: “1”, “probability”: “0.9507633”
Example 2:
Review Text: At first we were sent wrong size in one of the five shirts but I thought not too big of a deal was just a little big. But then only after a week wearing the shirts they are now tearing apart at the inseams. Armpit and sides on all shirts are tearing apart. This is not good quality at all. Never had this happen before and have purchased long sleeves in this material for my husband here at Amazon but not this brand or company here. Not worth the $30 we paid. I can’t send back used items that are falling apart due to poor workmanship and quality. and it will only let me put in defected item but then I have to return it says. That’s rediculous, can’t they see with the fotos the poor quality for just a week after being worn. I’m not wasting time on sending these back. Why would they want worn shirts back that were clearly made with poor quality and defects. This is my first complaint ever with amazon and I have purchased many items over the years. So you know it is bad.
Ground Truth: 1
SVM Prediction: “label”: “0”
CNN Prediction: “label”: “0”, “probability”: “0.99944204”
Example 3:
Review Text: I was really looking forward to these boots. Purchased a 12, I am a 12 in every shoe I own. The boot looks awesome and felt well made. When I put them on they seemed to be”longer” than I am used to. I checked the stamp on the inside and it was correctly stamped 12. But these boots were clearly larger, maybe even by a whole size. Returned item. Take caution when purchasing and read return policy. As a Prime member the description said free returns, when I picked my size, that option seemingly disappeared. Only valid if fulfilled by Amazon, be aware.
Ground Truth: 3
SVM Prediction: label”: “0”
CNN Prediction: “label”: “0”, “probability”: “0.8670363”
Example 4:
Review Text: The boots are very nice if you keep in mind that they are NOT work boots. More like a sneakers that look like boots. The leather is super soft and not waterproof. I treated mine with Sno-seal for waterproofing, it works but completely changes the look of the boot. The size is way off, you should follow timberland’s advice and order a full size smaller. I usually wear 9.5-10 and ordered a 9, it could have been a bit smaller. Also, the boot has almost no arch support so you will need an insole if you are flat footed like me. Other than that they are very comfy.
Ground Truth: 4
SVM Prediction: “label”: “1”
CNN Prediction: “label”: “1”, “probability”: “0.6297459”
Example 5:
Review Text: For under $20 dollars I wasn’t expecting too much. When I first started using the buds everything worked out fine, sound was a little muddy bass and mids are the focus for these buds. After a few days the earbuds would suddenly stop playing music, I would have to manual hit play on my phone which isn’t a deal breaker but then the left bud would intermittently stop and start again, this is the reason I returned these buds. I must have gotten a bad set since there’s so many positive reviews on these and I have owned several Blueido headphones without issues. I might get another set but I think I will do more research before buying my next set of wirless earbuds.
Ground Truth: 2
SVM Prediction: “label”: “0”
CNN Prediction: “label”: “0”, “probability”: “0.72702223”
CONCLUSION
Four different models were fit to predict whether a Amazon product review was positive or negative for a given product. Among the four models, the Convolutional Neural Network performed the best with a validation accuracy of 0.9107. SVM was the worst performing model with a validation accuracy of 0.8023. This can be improved if we increase the max_features hyperparameter within the tf-idf output that is fed into the SVM model. However, this will make the model training very computationally intensive. The sample examples show that our models perform satisfactorily on unseen new examples.
LINKS
- Dataset (Filename: amazon_review_full_csv.ta.gz)
- Dataset Research Paper
- fasttext
- Github
- Text Classification


Leave a comment